It is generally believed that stock markets, interest rates and investment returns move in periodic cycles. These cycles – which also contain tremendous noise — only become evident with hindsight and are hence very difficult to predict or measure in advance. Nevertheless, these cycles can have a profound impact on the sustainability of your retirement income.
If you retire and start to withdraw money from a diversified investment portfolio just as the market moves into a “bear” cycle your portfolio’s longevity can be at risk. Your nest egg will definitely not last as long as it would, under an equivalent spending plan which started during a “bull” cycle. This relatively obvious observation is often called the sequence-of-returns risk which is used by many in the insurance industry to explain the importance of protection during the so-called retirement risk zone. I too have elaborated elsewhere[1] on the importance of protection early on in retirement using analogies of spinning triangles, roulette wheels and Monte Carlo simulations.
In this brief article I would like to take slightly different approach to the issue, one that hopefully balances realism and accessibility.
I would like to illustrate exactly how a bull or bear market cycle can impact the sustainability of your portfolio by appealing to ideas from basic high school trigonometry and the mathematics of sine and cosine waves. And, although your skills might be rusty after these many years – and I’m not even sure they teach this anymore in high school – but my pedagogical objective is to emphasize the importance and impact of the timing of retirement.
First, allow me to review the basic mathematics of retirement spending. Assume you start with a nest egg of $100 and you invest this sum in a mutual fund that earns a real (i.e. after inflation) 5% per annum during your retirement. For simplicity, also assume this 5% is an annual percentage rate and compounds continuously over time. Then, if you withdraw $6 (inflation adjusted) per year, the nest egg will be exhausted in 35.8 years. If you withdraw $7 per year the funds will last for 25.1 years and at $8 spending you will be broke in 19.6 years. All of this assuming your portfolio earns the same consistent 5% annual rate, for ever.
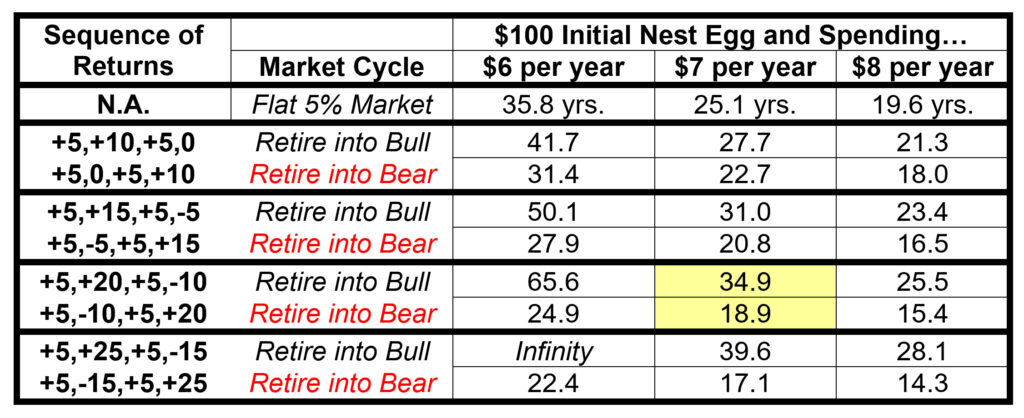
At this point I need you to suspend your disbelief and imagine a perfectly cyclical (sine wave) stock market; and I mean perfect with no randomness, noise or real world uncertainty. Look at Figure #1 for a picture that’s worth the next 200 words.
In that figure, (the blue line represent how the) investment portfolio starts-out earning an annualized 5% per annum on the first day of retirement. To be exact, this is 2 basis points in the first day of retirement, which is equivalent to 5% per annum divided by 250 trading days. The market then moves into a bull-market cycle so that your annualized returns slowly increase until they peak at 20% per annum (8 basis point per day) in approximately 19 months. In the language of sine waves, the market peaks after approximately p/2 years.
Then after hitting this peak markets start to decline so that approximately 19 additional months later, the market is back to earning an annualized 5%. It has gone from 5% to 20% to 5% over a period of p, approximately 3.14 years. Then, markets continue to decline for another 19 months, when investment returns reach -10% annualized (which is -4 basis points per day). Once again, please see (the blue line) in figure #1 for a graphical illustration of the evolution of this entire cycle from start to finish over 2p years.
This sine wave has an amplitude of plus or minus 15%, and ranges in value from -10% to plus 20%. You can think of this as a diversified and balanced portfolio of stocks and bonds. You retire and start to withdraw as markets move up.
As a perfectly symmetric alternative, consider the scenario in which you retire and start to withdraw funds while the market is earning the same 5% per annum, but it immediately moves into a bear market cycle so that 19 months into retirement you are earning -10% (i.e. losing money) per annum, and 19 months later you are back to 5% per annum and 19 months after that you are earning 20%. The cycle continues for ever. The two diametrically opposed paths are illustrated in figure #1. Both paths earn an average of 5% over the long run, but at any given point in time they are at completely different points in the cycle.
So far I have not mentioned withdrawal rates or values from the portfolio. I have only described the market and portfolio itself. Thus, it is important to note that if you only invested (and held) $1 at the start of a cycle (up or down, bullish or bearish) then at the end of a market cycle of 2p (=6.3) years you would have a compound annual return of 5% and the same amount of money, $1.37 in both cases[2].
When you are saving money, it doesn’t matter which path the market takes as long as you get the 5% annualized return!
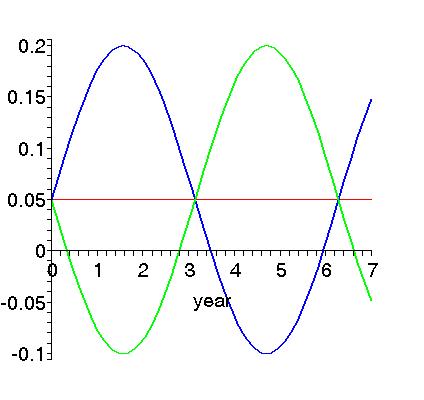
Now let’s look at what happens when you start retirement with $100 for example and withdraw $6, $7 or $8 per year on a continuous basis. I would argue that on any given day, week or month, you don’t really know in which direction the market will move over the next few years. It might go north or it might go south. The interesting thing is how long your portfolio will last based on the two starting cycles. It should be intuitive that your retirement will be worse-off if markets go south versus north. But how bad will it be?
Figure #2 tells the story and Table #1 summarizes the main results. For example, if you are withdrawing $7 per year and you are invested in a relatively volatile asset class that fluctuates between +20% and -10%, the portfolio can last anywhere between 34.9 years to 18.9 years depending on where – in the cycle – you start retirement. Figure #2 is a graphical illustration of the possible range of outcomes based on Figure #1. As you can see from the same table, if you invest in (even) more volatile asset classes that range from +25% to -15% per year, the range of outcomes is an even wider 17.1 years to 39.6 years.
Another important insight is the impact of the spending rate. Notice that when you are spending $8 per year, the gap between the “good” sequence and the “bad” sequence of returns is only 3.3 years in the first row (low risk). This same gap is 10 years when spending is reduced to $6 per year. At first glance this should seem odd. Why is the sequence of returns effect more powerful at lower spending rates? Of course, the answer is that this is a relative effect. If you spend more (i.e. $8) you will be worse off in terms of sustainability horizon regardless of the sequence, compared to only spending $6 per year. That said the gap between worst and best case scenario gets worse (not better) the less you spend. This impact becomes more pronounced at greater volatility levels. Starving yourself won’t immunize you from a bad sequence of returns.
In sum, unless you know who is on first — sine or cosine? – make sure to protect your nest egg during the fragile first decade of retirement.
Table #1: How Long Does the Money Last in Retirement?
Assuming Your Portfolio Cycles around an Average 5% Return per Year
Note: The first row displays the time (year) at which you exhaust the retirement portfolio, subjected to spending rates of $6 or $7 or $8 per initial $100 nest egg and assuming you continuously earn 5% (after inflation). The remaining rows display the time (year) of ruin assuming your earn 5% on average, but cycle between various extremes.
Figure #1: Markets will cycle over time even if you earn 5% on average.
Note: The flat (red) line denotes a portfolio that earns 5% every year during retirement. In contrast, if you start retirement in a bull-market cycle your portfolio will experience above average returns during the first three years (blue line). But, if you enter a bear-market cycle you will earn below average returns during the first three years (green line). In either case you will earn the same 5% average over the long run. In the above picture, the range of returns is (-10%, +20%.)
Figure #2: Retirement in a Bear versus Bull Cycle.
Spending $7 per $100 of initial nest egg
Note: The smooth middle (red) curve denotes your portfolio’s retirement path assuming it earns 5% per year, every year. The upper (blue) curve assumes you enter retirement in a bull-market cycle and the lower (green) curve assumes you start in a bear-market cycle. The sustainability gap between the two extreme scenarios is approximately 16 years.
Technical Appendix:
Depending on whether you retire directly into a (1) bull market or (2) bear market, your portfolio will satisfy one of the following two Ordinary Differential Equations (ODEs):

The Greek letter m denotes the average return and the letter s denotes the volatility, or instantaneous standard deviation which could be zero. The letter C denotes the annual spending rate in dollars, per initial nest egg of $100. For technical reasons, I will assume that either of these wealth processes will be absorbed at zero if they ever hit zero, so that W(t) is only defined over positive values.
Note that both sin(0)=0 and sin(p)=0 so that both equations (eq.1, eq.2) start with an instantaneous investment return of m multiplying the wealth level. But then, as time moves on the investment return multiplying the wealth level W(t) will increase in (eq.1) and decline in (eq.2). At time t = p/2, which is roughly 18 months, the instantaneous investment return will reach a value of m+s in equation (eq.1), but will decline to m-s in equation (eq.2). Recall that sin(p/2) = 1, but sin(3p/2) = -1. The two investment returns act counter cyclically to each other.
Note that when s = 0 the ODE can be solved explicitly to yield an expression for W(t). But, when s is positive, the solution to both ODEs can only be obtained numerically. This is because we are stuck with an expression that is the integral of e to the power of cos(t), which does not have a closed-form solution. The results in Table #1 are based on numerical integration.
[1] See the paper by M.A. Milevsky and T.S. Salisbury entitled: “Asset Allocation and the Transition to Income” which is available at www.ifid.ca
[2] If you think of r(t) as the instantaneous investment return which fluctuates symmetrically from 5% to 20% to -10% to 5% over a period of 2p years, then one dollar invested at time zero will accumulate to![]() which in our case is
which in our case is ![]() .
.
(This is a longer version of a condensed article that appeared on ThinkAdvisor.)